
In machine learning, there are different approaches to building effective learning representations. One of them that appeared first and up to this day continues to be quite a popular way of teaching machines to learn and make predictions, is supervised learning.
In this article, you will learn what supervised learning is, how supervised machine learning models are built and how they are used for real-life applications.
The definition of supervised learning
Supervised learning is a type of machine learning that requires a teacher, or “supervision,” to learn patterns from data. The teacher provides the algorithm with a set of input-output pairs, where the input is the data, and the output is the corresponding label or target. It needs to learn to match the new data with the selected labels. The programmer supervises the process and checks the progress of the model, for example, whether the dataset is big and representative enough or whether the model needs fine-tuning to learn faster.
It can look something like this:
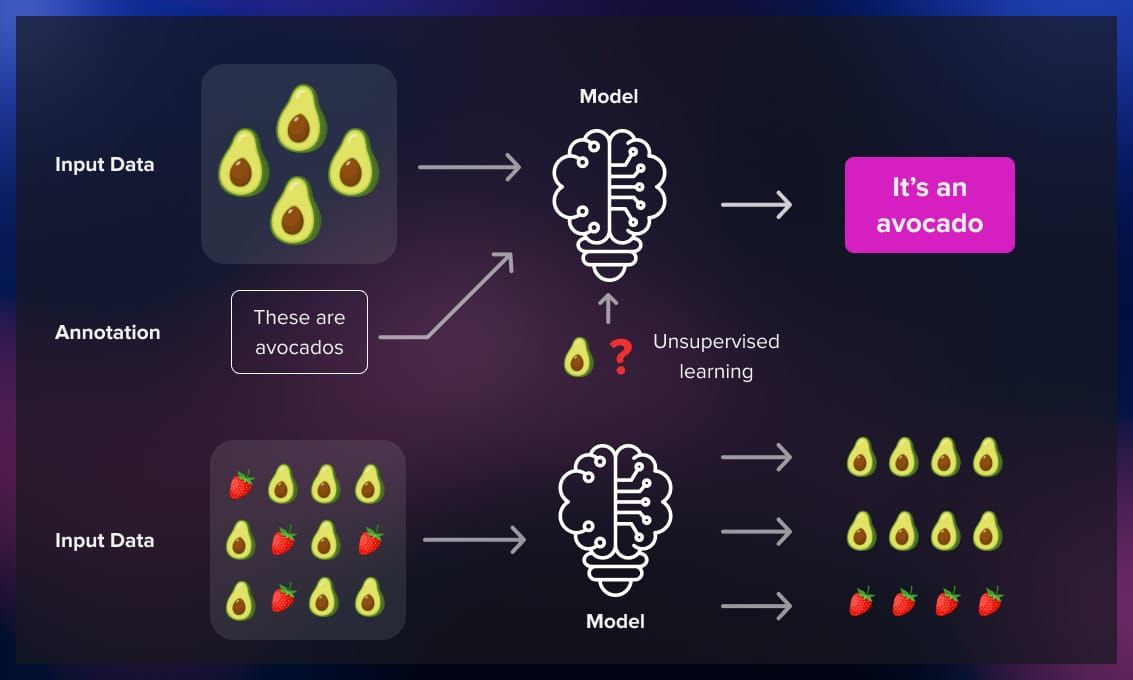
On the input, the algorithm is provided with various images of apples and the corresponding label “apple.” This is how the algorithm is trained, or made to learn. Then, when the algorithm is shown just one image of an apple, it should be able to correctly label it.
For real-life tasks, for example, classification tasks such as sorting different fruits, the computer will be able to recognize the apples and sort them into a separate category.
Key components of supervised learning
Supervised learning is based on the interplay between the training data, model architecture, loss function, and optimization algorithm. These key components work in harmony to enable algorithms to learn from data and make accurate predictions.
1. Training data
At the heart of supervised learning is the training data—a curated set of examples that serves as a guide for the algorithm. This dataset consists of pairs of input features and their corresponding output labels. The quality, size, and diversity of the training data play a key role in determining the success of the learning process. For example, if you train an algorithm that has to distinguish between cats and dogs, you should provide their images in various poses and breeds. Otherwise, it will be difficult for the computer to recognize them.

A well-prepared training dataset ensures that the algorithm can generalize its knowledge to make accurate predictions on the new data.
2. Model
The model is the mathematical representation of the relationship between input features and output labels. It defines the hypothesis space in which the algorithm searches for the best-fitting function.

The architecture of the model can vary depending on the nature of the problem. You can use a simple regression algorithm or a neural network with billions of parameters (however, it’s usually the case for unsupervised learning). During the training phase, the model adjusts its parameters iteratively to minimize the difference between its predictions and the actual output labels in the training data.
3. Loss function
The loss function is a crucial component that quantifies the error between the predicted outputs and the actual output labels. The goal during training is to minimize this error. Common loss functions include mean squared error for regression problems and categorical cross-entropy for classification tasks.
The choice of the loss function depends on the nature of the problem being addressed, and it guides the optimization process by providing a measure of how well the model is performing.
4. Optimization
In machine learning, when we talk about optimization, we’re essentially trying to make our model perform as well as possible. Imagine you have a computer program (a model) that’s trying to learn something from data (like recognizing cats in pictures). The goal is to make this program really good at its job. By optimization we usually mean a process that leads us to the selected loss function reduction.
Loss function reduction can be achieved by:
1. Model parameters tuning. Think of a hiker trying to find the lowest point in a hilly area. The hiker takes steps in the steepest downhill direction to reach the lowest point. Similarly, model parameters turning with, for example, gradient descent, helps the model find the minimum error by adjusting its parameters in the direction that reduces the error the most.
2. Hyperparameter tuning. Imagine you have a recipe, and you want to find the perfect combination of ingredients for the best taste. In machine learning, hyperparameters are like those ingredients. Hyperparameter tuning is the process of tweaking the model’s performance for optimal results before a learning algorithm is trained.
3. Cross-validation. Let’s say you have a group of friends who are taste-testing your dishes. To make sure your recipe is universally good and not just catering to one person’s taste, you might let different friends taste different parts of the dish. Similarly, cross-validation influences loss function in the opposite way to the optimization process itself, helping to prevent overfitting.
4. Feature engineering. Think of feature engineering as selecting the right ingredients for your recipe. Sometimes, you need to choose the most relevant aspects of your data to make your model better. For example, if you’re trying to predict house prices, the number of bedrooms might be more important than the color of the front door.
5. Ensemble methods. Ensemble methods in machine learning involve combining the predictions of multiple models to improve overall performance. It’s like having different chefs bring their unique skills to create a delicious dish.
These techniques help to enhance the model’s performance.
How does supervised learning work?
At the core of supervised learning is the training data. For instance, in a facial recognition system, an image of a face would be the input, and the label would specify the person’s identity. This labeled dataset serves as the foundation for the algorithm to learn and generalize patterns.
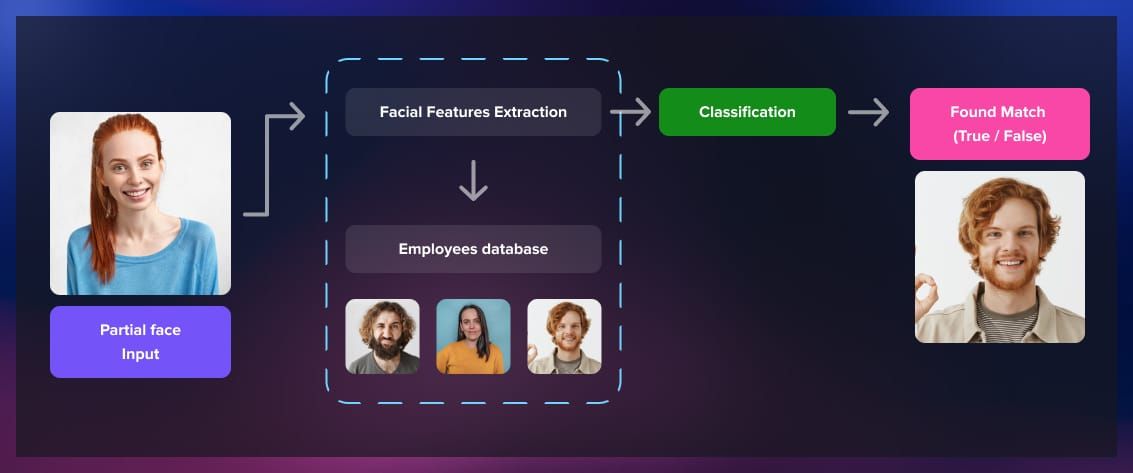
A supervised learning algorithm also needs a model, which is a mathematical representation capable of mapping input features to output labels. The model is initialized with random parameters, and its task is to adjust these parameters during training to create a predictive blueprint.
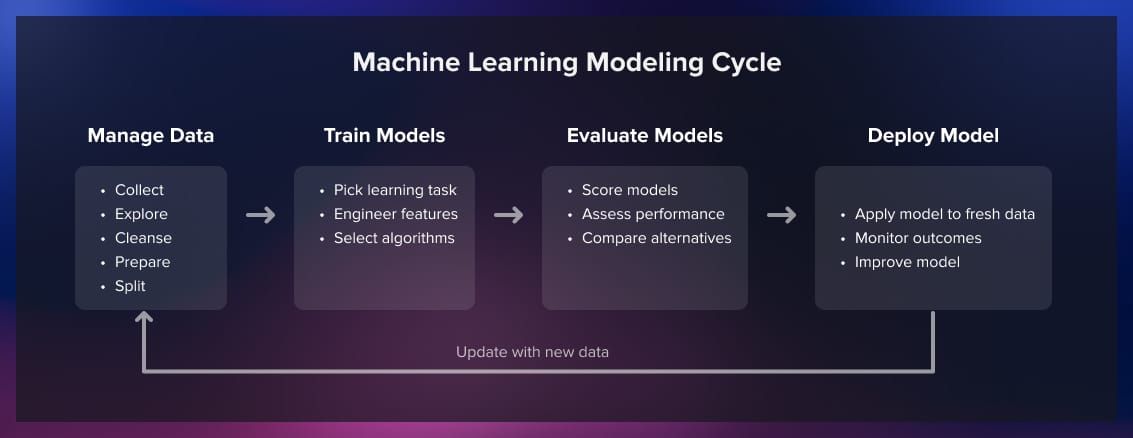
The training process is an iterative cycle where the algorithm refines its understanding of the relationships between input and output data. During each iteration, the model makes predictions on the training data, and the predictions are compared to the actual labels using a chosen loss function. The loss function quantifies the disparity between predictions and actual values, guiding the algorithm to minimize this discrepancy.
Once the model is trained on the labeled dataset, it is evaluated on a separate set of data called the test set. This allows for an unbiased assessment of the model’s ability to generalize its learning to new, unseen data. A well-performing model exhibits accurate predictions on the test set.
After successful training and evaluation, the supervised learning model is ready for deployment in real-world scenarios. The deployment stage is moving the ML model to the actual environment where it’s going to be used, for example, installing it into the hardware for facial recognition.
Types of supervised learning
Supervised learning can be broadly categorized into two main types based on the nature of the output variable: classification and regression.
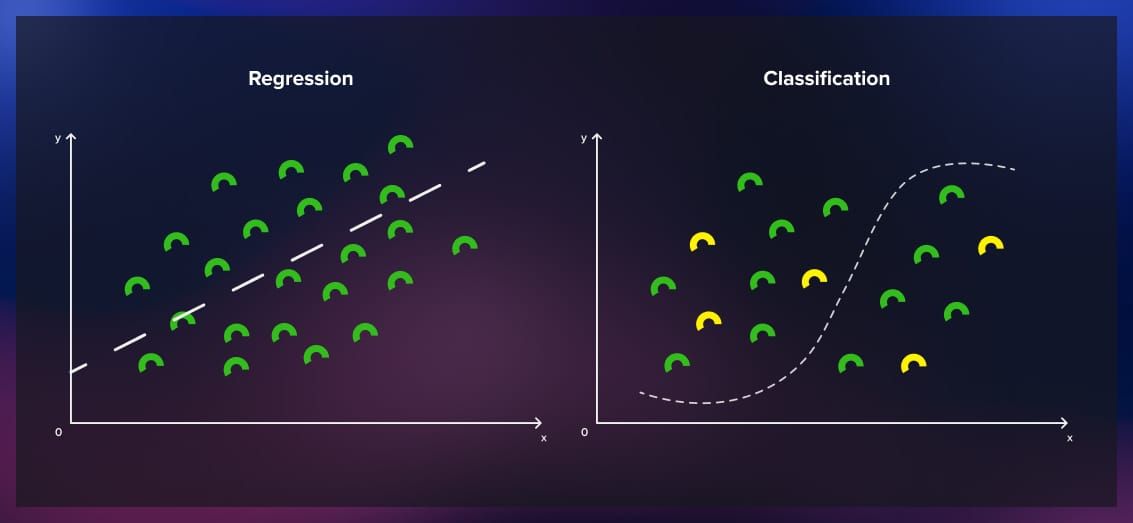
These types address different types of prediction problems.
1. Classification
In classification tasks, the goal is to predict the categorical class labels of new data points. The output variable is discrete and represents different classes or categories, as, for instance, in our earlier example of sorting fruits.
2. Regression
In regression tasks, the goal is to predict a continuous numerical value. The output variable is a real number, and the algorithm learns to establish relationships between the input features and the continuous target variable. Regression is used in scenarios where the output is a quantity, such as predicting house prices, temperature, or stock prices.
Supervised machine learning algorithms
Common algorithms for classification tasks include:
- Logistic regression. Logistic regression is used to predict the probability of an instance belonging to a particular class. It’s usually used for binary classification problems. It takes the input data and maps the input features to a probability score between 0 and 1. Then it assigns the instance to the class with the highest probability.
- Decision trees. Decision trees are a tree-like model where each internal node represents a decision based on a feature, each branch represents the outcome of that decision, and each leaf node represents the final class label. They’re intuitive for decision-making and easy to interpret, making them popular for both classification and regression tasks.
- Support vector machines (SVM). Support vector machines are powerful algorithms for both classification and regression tasks. They work by finding the hyperplane that best separates different classes in the feature space. SVM aims to maximize the margin between classes, and it can handle complex relationships in high-dimensional spaces.
- K-nearest neighbors (KNN). K-nearest neighbors is a simple and intuitive algorithm used for classification and regression tasks. It classifies an instance based on the majority class of its k nearest neighbors in the feature space. It’s effective for smaller datasets but might be computationally expensive for larger ones.
- Random forest. Random forest is an ensemble learning method that builds multiple decision trees and combines their predictions. Each tree is trained on a random subset of the data and features, reducing overfitting and increasing overall accuracy. Random Forest is robust and performs well in various types of data.
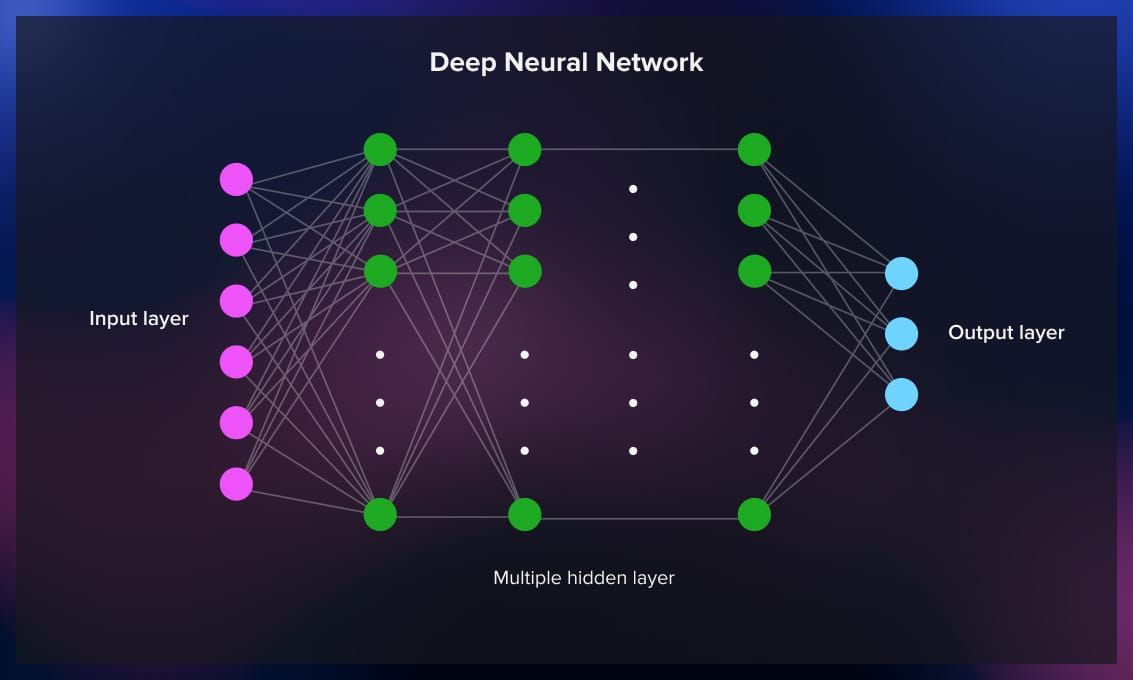
- Neural networks. Neural networks, or artificial neural networks, are a class of models inspired by the structure and function of the human brain. They consist of interconnected nodes (neurons) organized in layers. Neural networks are used for complex tasks like image recognition, natural language processing, and more. Deep neural networks, or deep learning, involve multiple hidden layers, allowing them to learn intricate patterns in data.
Common algorithms for regression tasks include:
- Linear regression. Linear regression is used for predicting a continuous outcome based on one or more input features. It assumes a linear relationship between the input variables and the target variable, fitting a straight line to the data to make predictions.
- Ridge regression. Ridge regression is a regularized linear regression technique that adds a penalty term to the traditional linear regression objective. This penalty term (L2 regularization) helps prevent overfitting by discouraging overly complex models. It is particularly useful when there is multicollinearity among the input features.
- Lasso regression. Lasso regression is also a regularized linear regression method. However, Lasso uses L1 regularization, which tends to produce sparse models by driving some coefficients to exactly zero. This feature selection property makes Lasso useful for variable selection in situations where only a subset of features is relevant.
- Decision trees (for regression). Decision trees can also be used for regression tasks. Instead of predicting a class label at the leaves, each leaf in the tree represents a specific continuous value. The decision-making process involves recursively splitting the data based on feature values until the final predicted values are assigned to the leaf nodes.
- Support vector machines (for regression). Support vector machines can be adapted for regression tasks, known as Support Vector Regression (SVR). In SVR, the goal is to find a hyperplane that best fits the data with a specified margin of tolerance. It aims to minimize the deviation of predicted values from the actual values, providing a flexible approach for regression tasks.
- Neural networks (for regression). Neural networks can be applied to regression problems by modifying the output layer to have a single node without an activation function, making it capable of predicting continuous values. The network learns complex relationships in the data through multiple hidden layers and adjustable weights, allowing it to capture intricate patterns and make accurate regression predictions.
Real-life applications of supervised learning
Let’s consider a real-life example for each of the mentioned algorithms:
1. Logistic regression: predicting customer churn
Imagine that you work in a telecom company and want to predict whether a customer is likely to cancel their subscription based on various features such as usage patterns, customer service interactions, and contract details. Logistic regression can be employed to model the probability of a customer churning and help the company take proactive measures to retain customers.
2. Decision trees: loan approval
Banks can automate the process of approving or rejecting loan applications based on applicants’ financial history, credit score, income, and other factors. A decision tree can be built to guide the loan approval process to provide bank clerks with a clear and interpretable set of rules for making decisions.
3. Support vector machines (SVM): email spam classification
In email filtering, SVM can be used to classify emails as spam or not spam. The algorithm would find a hyperplane that best separates the features of spam and non-spam emails, maximizing the margin between the two classes and improving the accuracy of spam detection.
4. K-nearest neighbors (KNN): handwriting recognition
KNN can be employed to recognize handwritten digits. Given a new digit, the algorithm looks at the k closest examples from the training dataset and classifies the digit based on the majority class among its nearest neighbors.
5. Random forest: predicting disease outcomes
You can use random forest to predict the likelihood of disease outcomes, for example, recovery, relapse, or deterioration based on patient demographics, medical history, and test results. The ensemble nature of random forests helps improve predictive accuracy and generalization.
6. Neural networks: image recognition in autonomous vehicles
Autonomous vehicles use neural networks for image recognition to identify pedestrians, other vehicles, and road signs from camera inputs. Deep neural networks, with their ability to learn complex hierarchical features, can handle the intricate patterns and variations present in real-world images, contributing to safe navigation.
7. Linear regression: predicting house prices
A real estate agency can predict house prices based on various features such as square footage, number of bedrooms, location, and proximity to amenities. Linear regression can be applied to model the relationship between these input features and the continuous target variable, which is the price of the house. The model fits a straight line to the data, allowing the agency to estimate house prices for new properties or assist clients in setting appropriate listing prices.
8. Ridge regression: predicting stock prices
In finance, predicting stock prices is a challenging task due to the complex and dynamic nature of the market. Ridge regression can be employed to predict stock prices based on various financial indicators, such as historical stock prices, trading volumes, and economic indicators. The L2 regularization in ridge regression helps prevent overfitting and improves the model’s generalization to new, unseen data.
9. Lasso regression: marketing campaign optimization
It’s possible to predict advertising budgets by identifying the most influential factors that contribute to the success of a campaign. Lasso regression can be used to build a predictive model considering features like ad spend on different channels, target audience demographics, and social media engagement. The L1 regularization in Lasso encourages sparsity, helping to highlight the most relevant features and guide the allocation of resources to the most effective channels.
10. Decision trees (for regression): predicting energy consumption
An energy company can predict daily energy consumption based on various factors, such as temperature, day of the week, and holidays. Decision trees for regression can be employed to model the non-linear relationships between these features and the continuous outcome of energy consumption. The resulting tree structure provides insights into the key factors affecting energy usage on different days.
11. Support vector machines (for regression): predicting sales revenue
You can predict monthly sales revenue based on factors like marketing spending, seasonality, and economic indicators. Support vector regression (SVR) can be applied to find a hyperplane that best fits the relationship between these input features and the continuous target variable, i.e., sales revenue. SVR allows the company to make accurate predictions while tolerating a certain margin of deviation.
12. Neural networks (for regression): weather forecasting
Meteorologists are able to predict future temperatures based on historical weather data, air pressure, humidity, and other atmospheric conditions. Neural networks can be employed for regression tasks, with the output layer modified to produce a continuous output. The network learns complex patterns in the data, enabling accurate temperature predictions for different locations and timeframes.
Conclusion
Supervised learning offers ML engineers a powerful tool to create intelligent and adaptive applications. With its applications ranging from image recognition to medical diagnosis, it plays a vital role in enhancing the capabilities of software. As technology continues to advance, understanding and leveraging supervised learning will be crucial for software development companies aiming to stay at the forefront of innovation.
Read more: