The journey of a machine learning engineer doesn’t stop when a model is deployed in production. It’s like having a garden—you can’t just plant the seeds and walk away, you have to keep an eye on your plants to ensure they grow well in all sorts of weather. Just like traditional gardening tools won’t help much in a hydroponic setup, monitoring machine learning systems isn’t the same as watching over regular software.
So how do you tend to these machine learning models once they’re up and running? What are the “growth signs” you need to look out for? Which tools can make your job easier? In this blog post, you will find comprehensive information on model monitoring, including its stages, focus, helpful tips and tools.
Why are ML model monitoring and management in production necessary?
Machine learning model monitoring and management in production are essential aspects of modern data-driven businesses. When we train ML models on specific data, the goal is to use these models to make accurate predictions when faced with new, unseen data. In the production stage, these models encounter real-world data which can be much more diverse and challenging than the initial training set.
Without adequate model monitoring, we run the risk of our models becoming outdated or misaligned with current data trends, resulting in bad performance. Additionally, model performance can degrade over time due to what is known as “concept drift,” where the statistical properties of the target variable transform over time. Detecting such shifts early on is crucial to maintaining the effectiveness of ML models.
As for model management, it ensures that our models are up-to-date and performing optimally. It allows us to maintain version control, compare different models, validate model performance, and comply with regulations and ethical guidelines.
One of the major challenges in model management is maintaining a robust infrastructure that allows for continuous integration, continuous delivery, and continuous training of models. As models are updated or retrained, it’s vital to have a system that manages these versions and deploys them without disrupting the existing services.
What are the key steps of model monitoring and management in production?
The basic roadmap for model monitoring and management in the production environment involves the following tasks, which we will explain in more detail later on:
- Identify potential issues with your model and the system facilitating its operation before they begin to have a detrimental impact on business value.
- Resolve issues with models in production, as well as the inputs and systems that support them.
- Ensure that the model’s predictions and outcomes can be interpreted and documented.
- Keep the model’s prediction process open and comprehensible to stakeholders for suitable governance.
- Ultimately, establish a mechanism for continuous maintenance and enhancement of the model in production.
What has to be monitored?
ML model monitoring happens on two levels: functional and operational.
Functional monitoring focuses on assessing the accuracy of the model. It also involves conducting regular tests and validation to ensure the model’s predictions align with the expected outcomes.
Operational monitoring, on the other hand, involves tracking the model’s behavior and performance in the production environment. This includes watching over resource utilization, response time, and error rates to identify any anomalies or deviations from the expected behavior.
Functional monitoring
Functional level monitoring involves monitoring three key areas, which provide data scientists and ML engineers with insights into the model’s performance:
- input data;
- the model;
- output predictions.
Input data
Since models depend on their input data, it’s crucial to ensure that the provided data aligns with the model’s expected input. Monitoring the input data helps detect any functional performance issues before they impact the overall performance of the ML system. It involves checking for the following.
Data quality. You have to ensure that the data types are consistent and equivalent. Factors that can compromise data integrity include changes in the source data schema or data loss, which can disrupt the data pipeline.
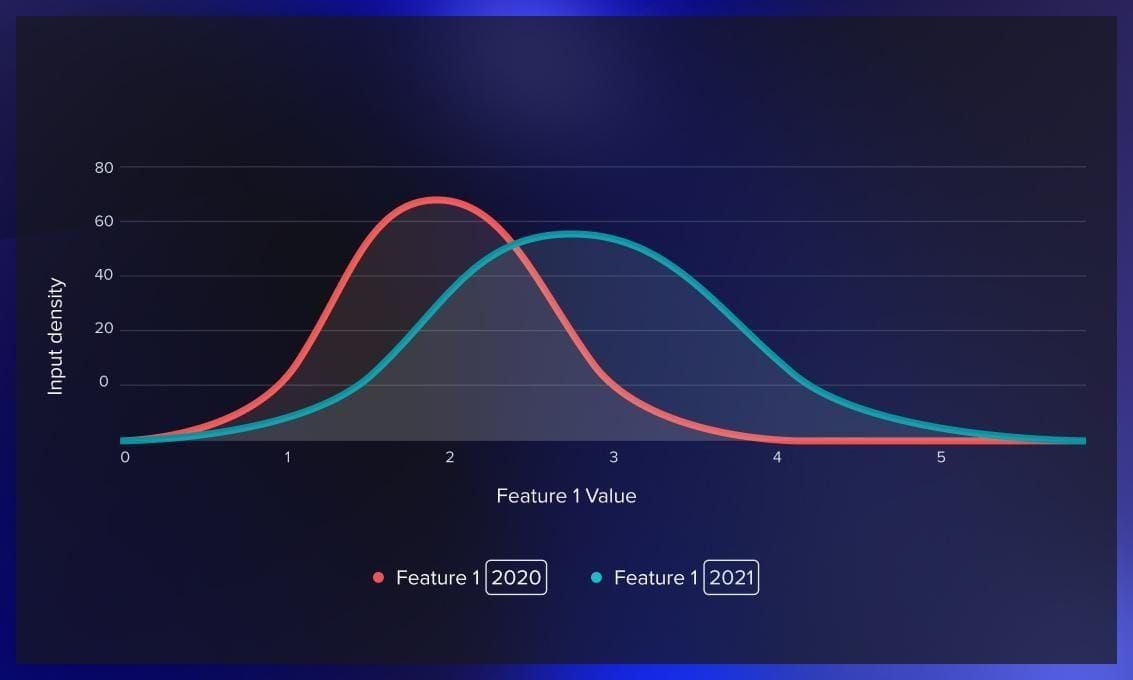
Data drift. Data drift monitoring provides insights into the dynamic environment and the context of the business problem you are addressing. Data drift means a shift in the distribution between the training data and the data encountered in production. As time passes, changes in input data distribution gradually affect the model’s performance, although at a slower rate than data quality issues.

Feature/attribute drift. These are changes or deviations in the characteristics or properties of input data. By monitoring feature drift, you can identify alterations in the statistical properties of each feature value over time. Feature drift occurs due to factors like data quality issues or shifts in the real world, such as changes in the preferences of business customers.
The model
One of the main factors affecting model performance is model drift. Model drift is the decline in a model’s predictive power due to changes in the real-world environment, which can be identified with the help of statistical tests. To understand and manage the model’s performance, it’s crucial to maintain a history of model versions and track their corresponding predictions.
The output
The ultimate goal of deploying a machine learning model is to solve a specific problem, so checking the output is key to ensuring it meets the desired performance metrics. For this, it’s helpful to check such indicators as ground truth and prediction drift.
What is ground truth? Let’s take the example of a model that recommends personalized ads to users, predicting whether a user will interact with the ad or not. When a user engages with an ad, it indicates its relevance. In such scenarios, to evaluate the model’s performance, you can compare it with actual outcomes, or ground truth.
Watch this video about using ground truth in deep learning:
However, oftentimes, ground truth is unavailable. In this case, an alternative would be monitoring prediction drift. It refers to changes in the distribution of predictions that can indicate potential issues. For example, if a model is used to detect fraudulent credit card transactions and there is a sudden surge in the proportion of identified fraud cases, it signals a change in the system. This could be due to alterations in the input data structure, issues with other microservices, or an increase in actual instances of fraud.
Operational monitoring
Operations engineers play a key role in ensuring the stability of the machine learning system. They monitor the machine learning application across three main categories: system performance, pipelines, and costs.
System performance
Key system performance metrics include memory usage, latency, and CPU/GPU utilization. These metrics not only provide insights into the model’s performance but also help identify potential bottlenecks and areas of improvement.
Pipelines
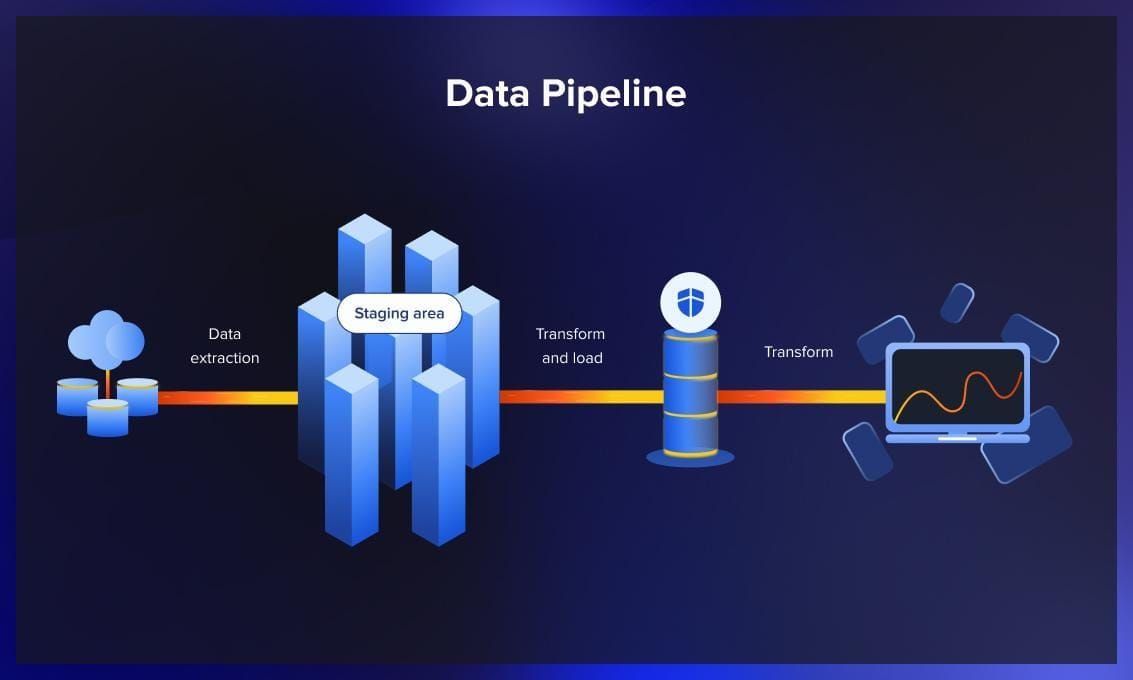
There are two essential pipelines that require your attention: the data pipeline and the model pipeline. Monitoring these factors closely can help prevent failures before they happen. The data pipeline is crucial: any neglect can lead to issues with data quality, which in turn could break the entire system.

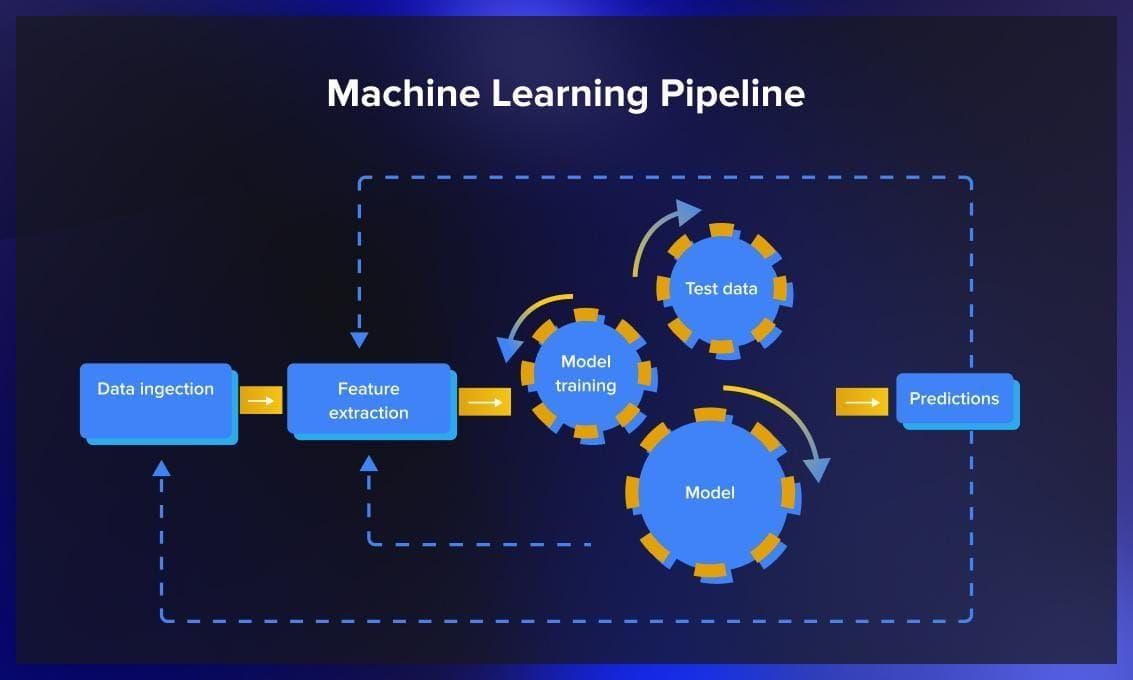
As for the model pipeline, you should keep an eye on potential trouble spots that could cause the model to fail when it’s up and running. These problems could be dependencies or issues related to how the model fits into the broader system.

Costs
Machine learning involves financial costs, including data storage, model training, and more. While machine learning can generate substantial value for a business, it is important to ensure costs are managed effectively. Continuously monitoring the expenses incurred by the machine learning application helps maintain cost-efficiency. For example, cloud vendors like AWS or GCP offer budgeting features that allow you to set spending limits and receive alerts when budgets are exceeded.
If the machine learning application is hosted on-premises, monitoring system usage and costs provides deeper insights into the most expensive components of the application. This enables informed decision-making regarding potential cost-saving or optimizations.
Tips on model monitoring in production
Since there are a lot of factors you need to keep track of in model post-production, it’s helpful to have a list of best practices to follow. This section provides helpful checklists to follow.
Data monitoring
- Process batch and streaming data using the same pipeline to facilitate troubleshooting of data pipeline issues.
- Look beyond overall dataset drift and monitor feature drift for more comprehensive insights.
- Implement a global data catalog to maintain high-quality metadata for reliable data management and lineage tracking.
- Conduct pre-launch validation on the evaluation set to establish a baseline performance before deploying the model into production.
Model monitoring
- Expect gradual performance degradation over time and pay attention to significant performance dips, which may indicate issues. The best way is using automated tools for detecting such anomalies.
- Perform shadow deployment and testing by comparing the performance of the challenger and champion models in production. Log predictions to track the performance of the new model.
- Use a metadata store (see our list further on) to track hyperparameters for versioned and retrained models. This improves auditing, compliance, lineage traceability, and troubleshooting.
Monitoring output
- Prediction drift can be used as a performance proxy for model metrics, particularly when ground truth data is unavailable, but it should not be the sole metric.
- Keep track of unreasonable outputs from the model, such as incorrect predictions with high confidence scores in classification models or negative scores in regression models where the base metric score should be zero for a given set of features.
ML Monitoring tools
Machine learning monitoring tools record the outcomes of models on production data and save it for additional analysis. Developers can take this data, manually annotate or correct it, and use it for future training iterations.
Prometheus
Prometheus is a monitoring and alerting toolkit initially developed at SoundCloud. Since its creation in 2012, it has gained popularity and now has a thriving community of developers and users. It is currently maintained as a standalone open-source project, independent of any specific company.
Prometheus gathers and preserves metrics in the form of time series data. Each individual data point in this system is linked with a specific timestamp and, optionally, with certain key-value pairs known as labels.
Its key features include:
- Multidimensional data model: Metrics are organized using metric names and key/value pairs, allowing for flexible data organization.
- PromQL: Prometheus Query Language (PromQL) provides a flexible query language, enabling you to use the multi-dimensional data model for data retrieval and analysis.
- No reliance on distributed storage: It operates autonomously with single-server nodes.
- Pull model for data collection: Time series data is collected through a pull model over HTTP, where Prometheus fetches data from monitored targets.
- Push model support: Prometheus also supports pushing time series data through an intermediary gateway.
- Service discovery or static configuration: Monitoring targets can be discovered dynamically through service discovery or configured statically.
- Graphing and dashboarding support: Prometheus offers various graphing and dashboarding capabilities for visualizing and analyzing metrics.
Grafana
Grafana is a web application for analytics and interactive visualization that operates as an open-source tool. It can be used to visualize the data collected by Prometheus.
By combining Prometheus and Grafana, you can create comprehensive dashboards that enable monitoring and tracking of your machine learning system in a production environment. These dashboards offer insights into the system’s performance and can be configured to generate alerts in case of unexpected events or anomalies. This ensures proactive monitoring and timely notifications to address any issues that may arise.
Arize
Arize is an ML issue detection and troubleshooting platform that provides observability for deployed models. It simplifies the process of managing large vector storage systems and monitoring data integrity. Arize enables the identification of data drift and ensures scalability and security independently of existing feature or embedding stores. It supports major ML frameworks and offers multiple methods for logging inference results, including cloud storage integration and SDK usage. Its unique feature is the automatic detection of text or image embeddings, allowing for continuous monitoring and comparison against a baseline. Arize also offers integration with various alerting tools and methods, including email, Slack, OpsGenie, and PagerDuty. Additionally, it supports automatic model retraining through the Airflow retrain module, specifically for AWS environments.
Neptune AI
Neptune AI is a metadata store designed to track ML experiments, store models, and centralize data related to machine learning models. It improves collaboration and standardizes model development processes. Neptune can be installed on-premise, in a private cloud, or as a managed service. It offers querying features and a user-friendly dashboard for visualizing experiment and production run results.
Neptune AI consists of client and web applications. The client integrates with ML code to log model runs and data details while the web application processes the logged data and provides utilities for analysis. The web interface enables result comparison, metric observation, and collaboration. Neptune uses workspaces to separate work by different teams, with projects organized based on runs within each ML task.
While Neptune’s monitoring capabilities are primarily focused on model training, its logging code can also be used for production inference tasks. It can log data-related metrics, model hyperparameters, error metrics, and system metrics like hardware usage. Neptune integrates with popular ML libraries, automatically capturing metadata and metrics.Moreover, it can integrate with data version control systems like DVC. Manual logging through the client library is also available.
The video below provides a brief overview of Neptune AI.
Fiddler AI
Fiddler AI is a platform for model performance management that offers continuous visibility and explainability for model training and inference tasks. It is focused on low-code analysis, providing a simple SQL interface and built-in dashboards. Fiddler supports A/B testing and enables an understanding of why predictions are made through explainable AI methods. It supports major ML frameworks and cloud-based tools, with features for monitoring production model metrics and detecting anomalies and drift in text embeddings. Fiddler’s comprehensive dashboard presents ML tasks as projects and includes tabs for monitoring, analysis, explanation, and evaluation.
Qualdo
Qualdo is a comprehensive platform that enables data and model quality monitoring. It supports multi-cloud architecture and works with various databases, making it suitable for data engineers, data scientists, and DevOps engineers. With built-in algorithms, Qualdo identifies data anomalies and provides reports and alerts. Its MQX offering specializes in model monitoring, detecting response decays, feature decays, and model failure metrics. Qualdo offers a managed service option or can be installed on-premises with the enterprise edition. The DRX tool measures data anomalies without coding and supports a wide range of databases. Qualdo prioritizes security, complies with OWASP guidelines, and integrates with notification frameworks. Additionally, it provides an SDK for machine learning model monitoring, enabling automated parameter retuning based on captured data.
Conclusion
In this article, we have seen why monitoring and management of machine learning models in production are essential. This ensures their continued performance, reliability, and alignment with the evolving data landscape.
By implementing proper monitoring practices, such as analyzing data and feature drift, and leveraging appropriate tools, you can proactively identify and address issues before they arise. As a result, you will be able to quickly and painlessly optimize ML deployments in a way that provides greater value for businesses – the ultimate goal they were designed for.


