
.png)
In this post, we share insights from Serokell AI experts on their investigation into drug-disease interactions. Specifically, they explored whether a drug has a positive, negative, or neutral effect on the treatment of a particular disease.
Serokell has collaborated with Neo7Bioscience, a molecular technology company, and Elsevier, an information and analytics firm that facilitates medical and biological research. With the data licensed from Elsevier, our specialists developed ML models that predict interactions between small molecules and diseases.
Drug-disease interaction prediction and biological sequence embedding
The task is related to big data analysis and consisted of assisting Elsevier with handling a large dataset derived from tens of thousands of research papers, which was condensed into a large graph. While not very large compared to datasets used in other ML fields like NLP and computer vision, this dataset contains a diverse array of biological entities such as diseases, proteins, and small molecules, along with various types of connections between them, notably clinical trials and regulations.
We focused on two major tasks: drug-disease interaction prediction and biological sequence embedding.
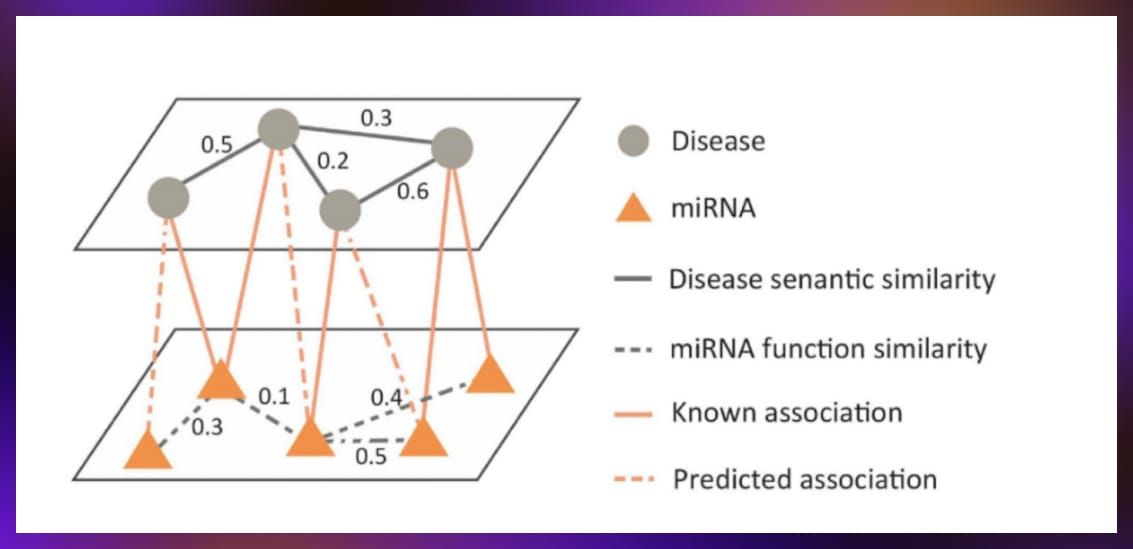
- Drug-disease interaction prediction involved analyzing information about various drugs and diseases to predict how they interact with the help of graph neural networks.
The data, stored in a graph format, features nodes representing drugs and diseases, with edges indicating known interactions derived from sources such as clinical trials. The goal is to predict unobserved connections (represented as dotted lines in the figure below) using additional types of nodes to enrich the information.
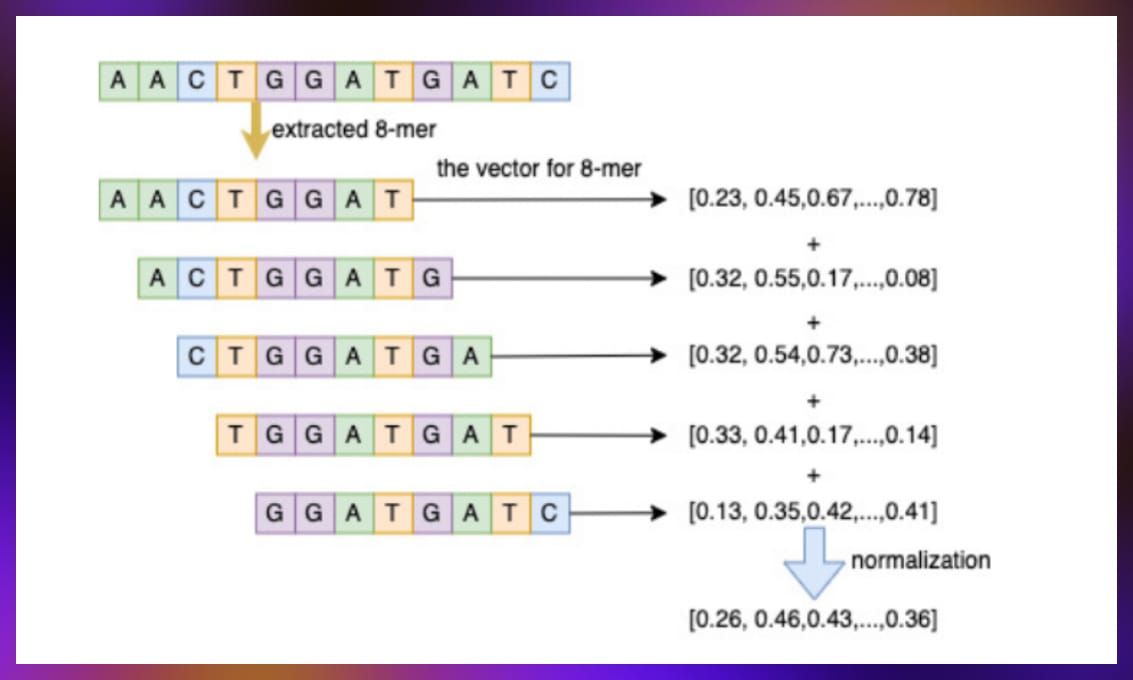
- Biological sequence embedding. This task consisted in compressing information about DNA and amino acid sequences into a compact vector form that can be utilized by models. This process involves taking a small segment of a sequence, processing it through a fixed-size window to generate a vector, and then combining these vectors to represent the entire sequence’s information. This technique is designed to enrich node information within the graph, thereby improving prediction accuracy.
Our process was based on machine learning graphs. In the sections below, we explain their basic principles and how we utilized them.
What is graph machine learning?
Graph machine learning uses data stored in graph formats rather than tables, images, or sequences. A graph in mathematics and computer science is a structure composed of a set of objects, which are referred to as nodes or vertices, connected by links called edges. Graphs are used to model relationships and processes in physical, biological, social, and information systems.
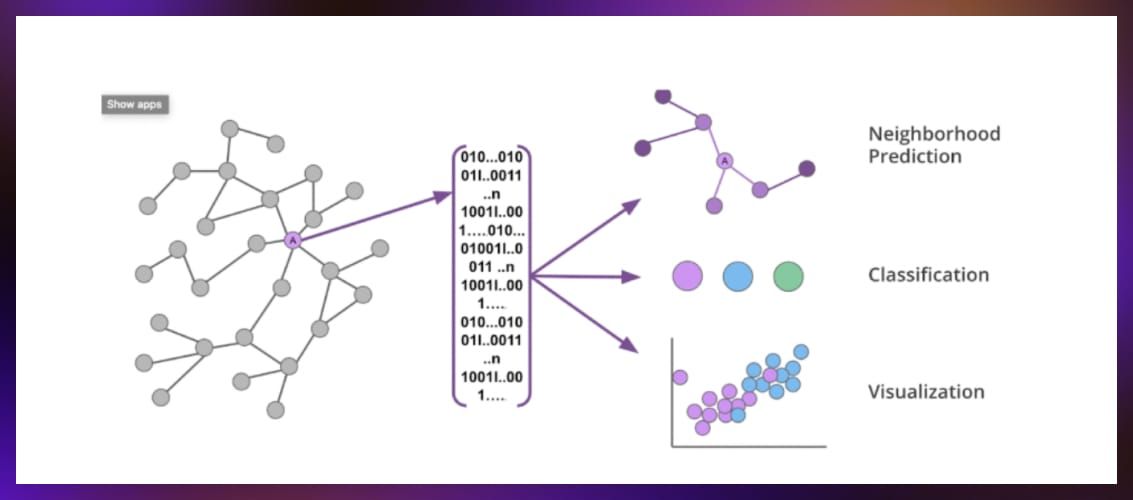
Graph machine learning combines graphs with the predictive capabilities of machine learning, making it a key tool in extracting insights from complex datasets. Graph machine learning can tackle a variety of tasks, including:
- Node classification: Assigning labels to nodes based on their attributes and connections.
- Link prediction: Predicting the likelihood of a relationship forming between two nodes. For example, this method can be used to predict whether a new drug candidate might interact with a specific protein, which could indicate its potential efficacy or toxicity.
- Graph classification: Determining the category of an entire graph is useful in drug discovery, where molecules (represented as graphs) can be classified into active or inactive compounds.
Graph neural networks
Graph neural networks (GNNs) have been increasingly used in machine learning over the past decade. By integrating the relational information inherent in the graph structure, GNNs facilitate a deeper understanding of complex network topologies, significantly enhancing the effectiveness of ML models.
GNNs are engineered to process data structured as graphs composed of nodes (vertices), edges, and occasionally, global attributes. These networks are able to convert graph components into comprehensible vector representations.
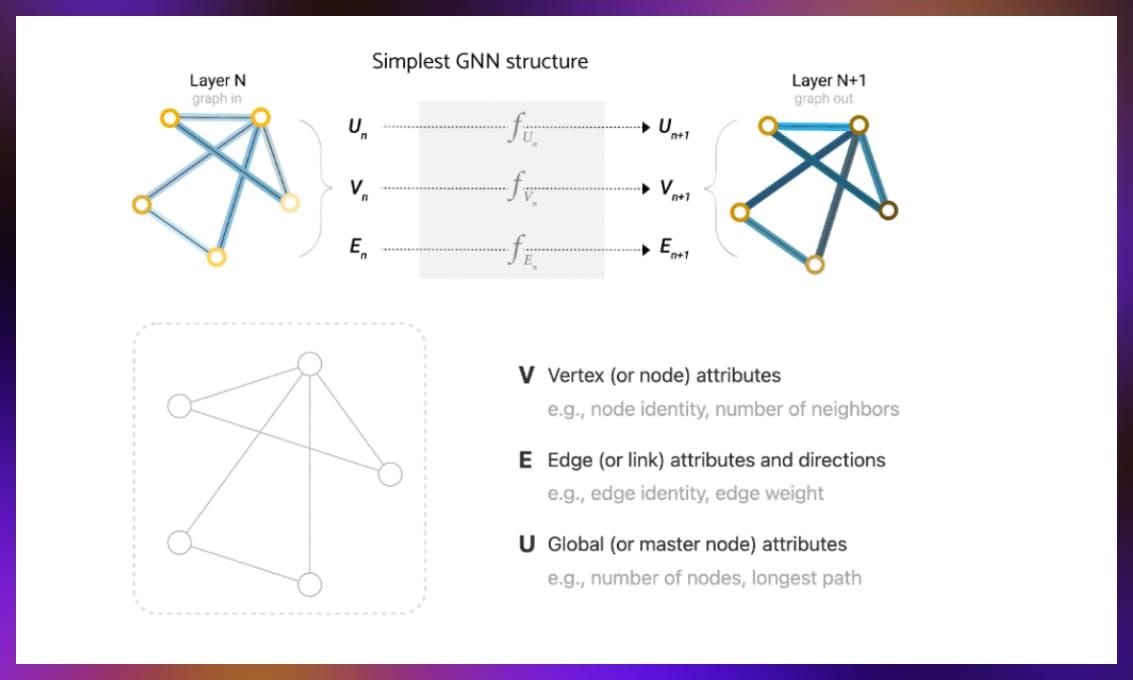
In practice, each component of the graph—be it edges, vertices, or global attributes—is initially mapped to a vector representation. The matrix nature of vector representations allows for direct application of MLPs, facilitating a layer-by-layer refinement.
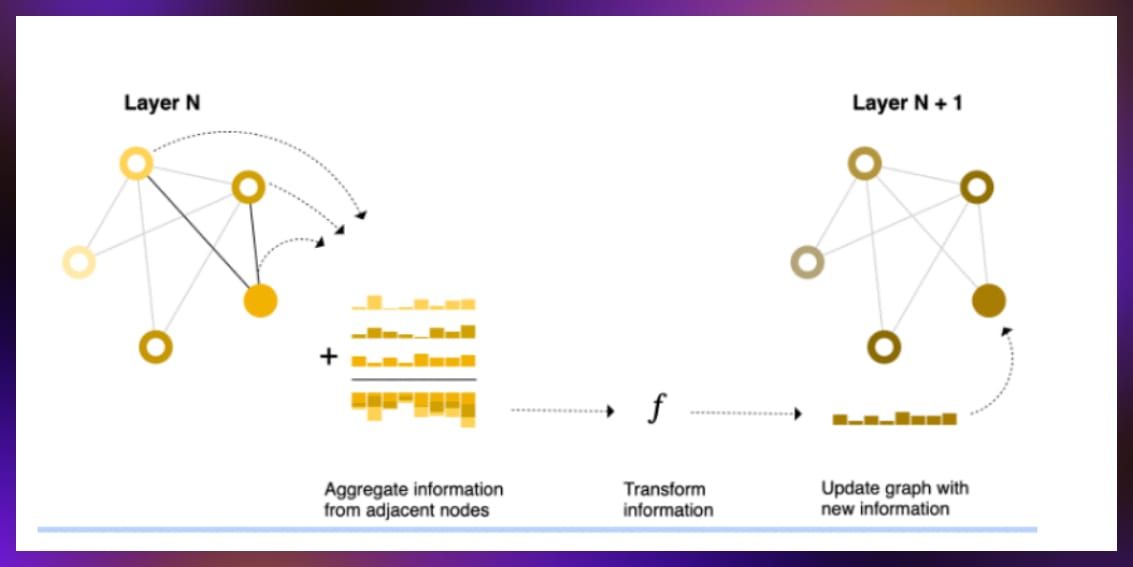
Message passing
A key feature of GNNs is the message passing mechanism, which helps isolate vertex information from the overall graph structure. This mechanism also enhances local graph structure for each vertex and increases its impact on the model. This mechanism allows nodes to gather information from their neighbors, enriching the model’s understanding of both direct and indirect connections. The process typically involves aggregating the vector representations of neighboring nodes using operations like summation, maximization, minimization, and averaging. These aggregated vectors are then transformed, often through a linear model, to produce updated and more informative node representations.
Graph convolutions
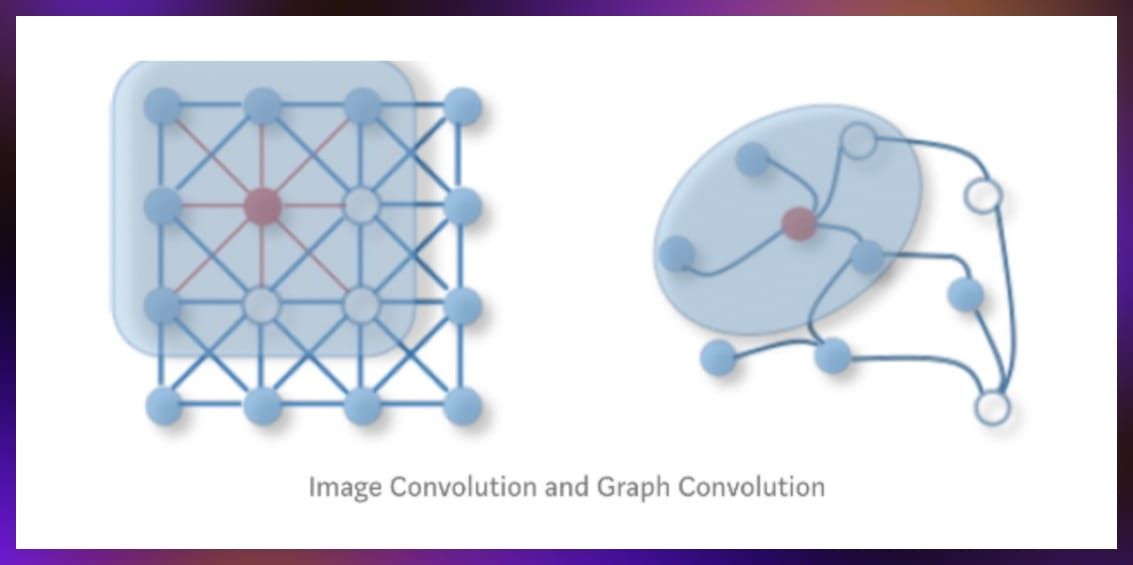
The message passing mechanism is the foundation for graph convolutions, allowing for the integration of neighbor information into node representations. This technique is similar to the convolutional operations in image processing but adapted to the graph domain. It facilitates the capture of local and global graph structures in the learning process. Through graph convolutions and message passing, GNNs can effectively learn from complex graph-structured data.
However, graph convolutions differ significantly from 2D methods in how they handle data, due to the irregular, non-grid-like structure of graphs. One important aspect is that graph convolutions aren’t about the dimensionality of the space they operate in. Graph convolutions focus on gathering and integrating information from a node’s immediate surroundings—whether those surroundings are defined in two, three, or any number of dimensions.
SimpleConv and GraphConv
SimpleConv and GraphConv are types of operations used in graph neural networks, each representing different methods of aggregating information from a node’s neighbors to update the node’s features. They are specifically designed to capture the structural and feature-based information present in graph data.
SimpleConv
SimpleConv, or Simple Graph Convolution, is a basic form of graph convolution. It is simple and efficient, especially in scenarios where relationships within the graph are straightforward or when computational simplicity is crucial.
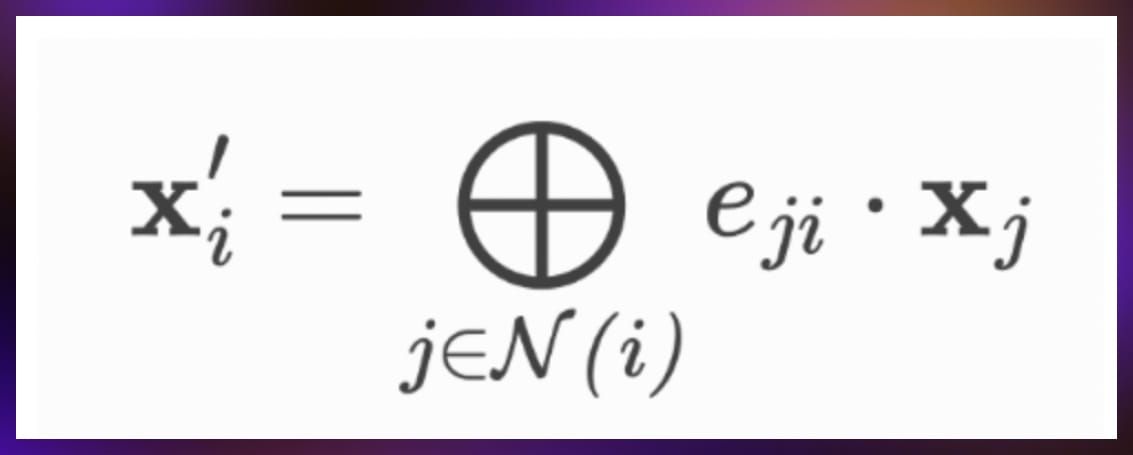
The key steps of this operation are:
- Aggregating neighbor features: This involves taking the features of neighboring nodes and combining them through summing, averaging, or taking the maximum.
- Feature transformation: After aggregation, the combined features might undergo a transformation, often using a simple linear transformation (e.g., multiplying by a weight matrix), but without additional parameters or sophisticated mechanisms.
- Non-learnable process: SimpleConv does not include trainable parameters within the aggregation step itself, making it more of a static feature transformation based on the neighborhood structure.
GraphConv
GraphConv, or Graph Convolution, is a more advanced form of convolution used in graph neural networks that typically incorporates trainable parameters, allowing the model to learn more complex patterns and relationships in the data.
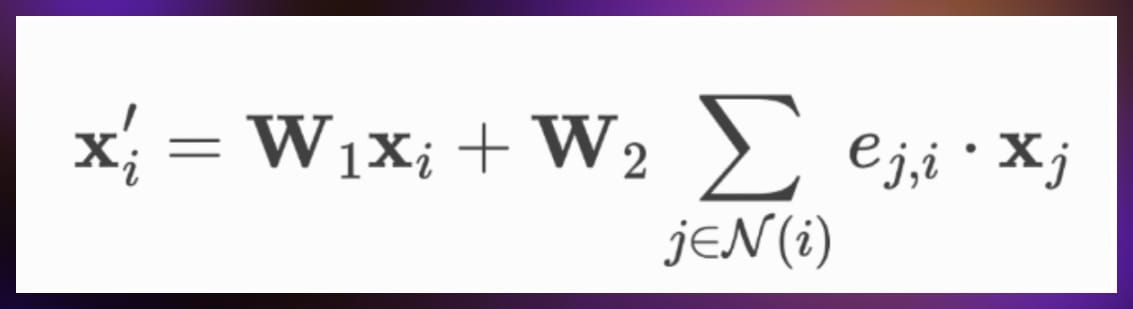
It generally involves:
- Weighted aggregation: Similar to SimpleConv, GraphConv aggregates features from a node’s neighbors, but it often includes trainable weights that allow the model to learn which features are more important during the aggregation process.
- Incorporation of node features: GraphConv not only aggregates neighbor features but also includes the features of the nodes themselves in the aggregation. This is done to preserve the identity of the nodes and to ensure that the node’s own features are considered along with its neighbors.
- Non-linearity: After aggregation, a non-linear activation function (like ReLU) is often applied to introduce non-linearity into the model, enabling it to capture more complex patterns.
How are GNNs trained?
Training graph neural networks, particularly for tasks like edge or link prediction, involves processing subgraphs instead of the entire graph.
Subgraphs are selected by randomly choosing nodes and exploring their vicinity. The process starts by representing each node with an initial vector (embedding), which then passes through a series of graph convolutions to update these representations based on the graph’s structure.
In edge prediction, which is a binary classification task, the goal is to determine whether an edge exists between two nodes. To achieve this, the model evaluates pairs of node embeddings. It assesses the similarity between these embeddings using metrics like cosine similarity, which forms the basis for predicting whether an edge is present. Given the binary nature of the task, binary cross-entropy is utilized to calculate the loss. Standard backpropagation techniques are then employed to train the model.
Graph types
When discussing Serokell’s work for Elsevier, it is necessary to make a distinction between graph types, specifically, homogeneous and heterogeneous graphs.
- Homogeneous graphs have uniform edge types and are simple and easy to use for processing and analyzing data.
- Heterogeneous graphs comprise multiple node and edge types. The complexity of their structure, while allowing for more nuanced modeling, also presents significant challenges in data interpretation and manipulation.
Dense and sparse graph data storage
A crucial aspect of developing models requiring complex feature representations is the ability to store additional detailed information about nodes and edges in matrices. Two main data storage methods include:
- Dense storage uses adjacency matrices, which are effective for smaller or densely connected graphs but become inefficient for large graphs with many potential connections.
- Sparse storage only records existing connections, employing adjacency lists. It significantly enhances storage efficiency and computational speed, making it ideal for large, sparsely connected graphs. This method also accommodates weights, either directly within the adjacency list or as a separate entity. Sparse graph representations are generally a better choice because of their space efficiency and alignment with modern data-intensive applications.
Directed and undirected graphs
Another important distinction to make is between directed and undirected graphs.
- Directed graphs facilitate relationships that flow from one node to another in a specified direction.
- Undirected graphs feature bidirectional relationships, essential for accurately modeling various real-world data interactions.
Data available in the Elsevier project
The data we have used is stored in a heterogeneous and directed format, chosen for its ability to efficiently represent directional relationships and to save space through sparse storage.
This setup, however, required significant adjustments to the original coding to accommodate the data’s directional properties. Even a small sample from the dataset, which includes just one small molecule, features nearly 21,500 edges. The complete dataset is even more complex, containing several hundred small molecules, 10 distinct node types and 158 different edge types.
We implemented our own algorithm based on GNNs that allows us to fully utilize the high-dimensional data and account for the biological specifics of certain effects.
Given the heterogeneous composition of the graph, which includes multiple types of nodes and edges, our strategy involves developing separate embedding models for each of the 10 node types to ensure that the information specific to each is precisely captured. Additionally, to handle the 158 distinct edge types, a unique GNN has been developed for each, allowing for customized processing that aligns with the specific characteristics of each edge relationship.
Navigating challenges: our progress and future plans
The collaboration began with a limited sample dataset containing just one small molecule, a constraint imposed by the nondisclosure agreement. The initially provided code, developed in TensorFlow by a previous researcher, encountered significant issues with checkpointing and logging. Furthermore, it was not equipped to handle the entirety of the dataset effectively.
In light of these issues, our ML team decided to switch to PyTorch Geometric (PyG) due to its enhanced capabilities for managing graph data. This transition allowed for the integration of improved functionalities, such as robust checkpointing and logging mechanisms. We also thoroughly documented the code to facilitate future modifications and extensions by researchers revisiting this work.
This approach also expanded the model’s scope to include every type of node present in the dataset, thus optimizing the use of available data. Preliminary testing on the small dataset revealed some overfitting, and yet, the model operated smoothly without any errors or warnings.
The next stage of Serokell’s collaboration with Elsevier will involve working with a more comprehensive dataset. This will be crucial for evaluating the model’s performance on a broader scale and refining strategies based on the findings.
We will also work on using paralog-type connections for enhancing the prediction quality for other types of connections, e.g. drug repurposing (paralog is a measure of similarity between two protein chains).
We will keep you updated on the results in our future publications.
Read more:


.jpg)